What would you do if you set a bold and enormous, industry-leading goal of being carbon negative by 2030? Like the influential management thinker Peter Drucker says, ”If you can’t measure it, you can’t improve it.“
The enormous project of reducing our greenhouse gas emissions depends on accurate and timely access to data. Through the collaboration between IS Administrative Technology (AT), the AT Providence Global Center team, Environmental Stewardship, and RESO, Providence has embarked on the journey of collecting, tracking, and reporting the usage, cost, and carbon emissions related to our services across ministries. Tracking aligns to our WE ACT framework, which outlines our five priorities to address and measure: Waste, Energy & Water, Agriculture & Food, Chemicals, and Transportation.
The WE ACT scorecard, a unique, innovative, one-of-a kind solution, is our path to well-organized, high-quality data. The scorecard started with humble beginnings as a manual Excel workbook and expanded to include 400+ metrics for 51 acute-care ministries across Providence. Along with the problem of scale, there were several other pain points, including errors due to manual intervention, compromised security, laborious data entry, slow time to report creation, and multiple versions of scorecards. We are painstakingly identifying the sources of data for each category, and our Administrative Technology-supporting Providence Global Center team in Hyderabad, India is carefully building it into the scorecard, which is updated monthly. Accurate data is the foundation of our environmental stewardship initiative.
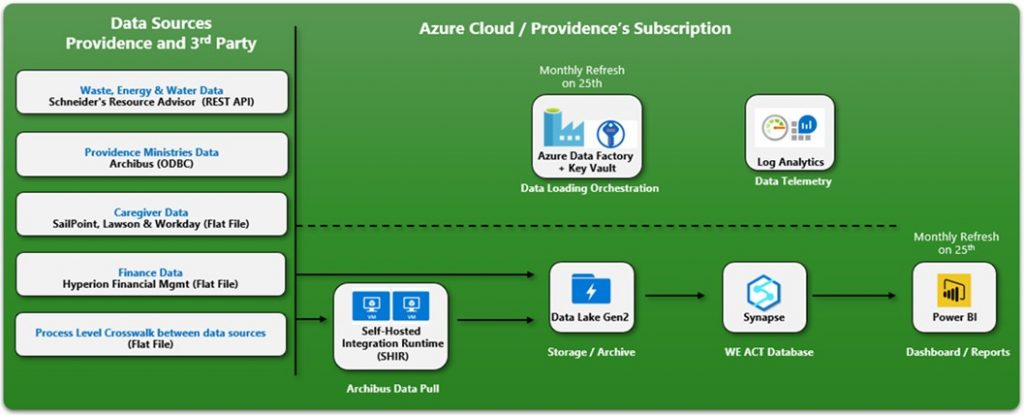
The digital WE ACT Scorecard ingests data from various sources within Providence and third-party vendors, such as Schneider Electric’s Resource Advisor API, into the Azure Data Lake every month. The data is later cleaned and transformed using Azure Data Factory. It is then stored in Azure Synapse Database in the form of a data model, making reporting in Power BI seamless.

Some of the early benefits of the digital scorecard have been improved data accuracy, data normalization for analysis, and a simplified and consistent user interface. We can now view the data trends over time, and share with regional executives and leaders for carbon emissions reduction. Currently, our WE ACT Scorecard covers 30% of Waste (W) and 90% of Energy & water (E) data from the WE ACT framework, starting from a baseline year of 2019. This challenging yet crucial effort will soon include all elements of this framework so that we can track and achieve our goal of carbon negativity.
More info
An “all-caregiver” view of the dashboard is not currently available. In the meantime, check out the WE ACT framework.
